Social Media Text Analytics is a way of examining and interpreting hidden business insights from the textual components of a social media post. A part of text analytics and the skill of interpreting and making meaningful business insights is to know exactly what it is you are looking for. It is all about they key words one uses to determine any trends, or themes amongst brands, competitors and so on. What are people commenting or retweeting about? A key question to help further the agenda of ones brand or make useful predictions for the future.
We will be analyzing the Twitter Keyword Report (TKR). The Twitter Keyword Report helps users uncover trends in twitter traffic. It will display results for any keywords and hashtags within a date range that the user may specify. The benefits of doing this could be limitless for many companies. It could allow a company to track brand products against one another or their competitors, monitor the success of past and current hashtags or marketing campaigns, locate certain patterns to help create strategical marketing plans for the future, and simply keeping tabs on your market.
A Competitive Analysis
Utilizing the Twitter keyword Report, will allow a user to have access to an in-depth pool of data that can easily aid in determining meaningful business insights. For this example I want to compare major coffee brands. As some may know, Starbucks, and Dunkin Donuts have released their Pumpkin Spice flavors earlier than usual this year. I decided to start my time frame from August 12th, 2020 to September 13th, 2020. This time frame will allow me to gather as much information as possible and could aid in showing me a number of trends.
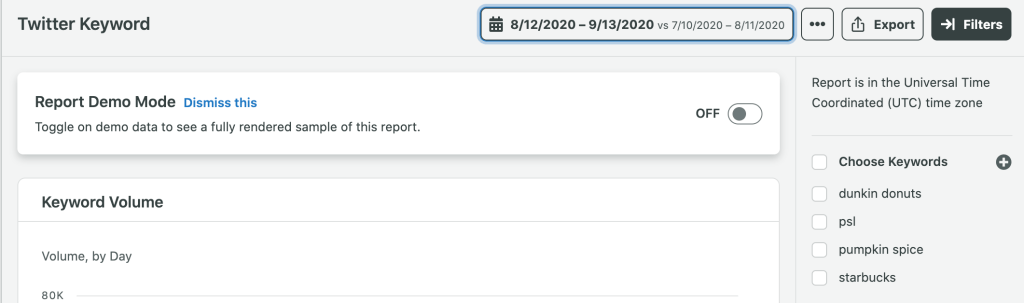
As you can see in the image above, the timeframe is stated and the four keywords I have decided to focus on. The four keys words I chose and why:
- Dunkin Donuts: One of the largest brands and a direct competitor of Starbucks
- Starbucks: One of the largest coffee brands as well and a direct competitor with Dunkin Donuts
- PSL: Stands for Pumpkin Spice Latte, is the abbreviated form
- Pumpkin Spice: I decided to use this to channel in more information from those who are talking about the flavor in general.
I decided to use Pumpkin Spice as a keyword as this could help show a further theme of how Starbucks or Dunkin could continue reaching new customers by allowing them to see how it is being talked about. This could allow them the potential of emerging themselves with a new product or experience to help relate to those potential new customers who may enjoy the flavor in different ways. Now let’s look at the following graph and see what we can find!
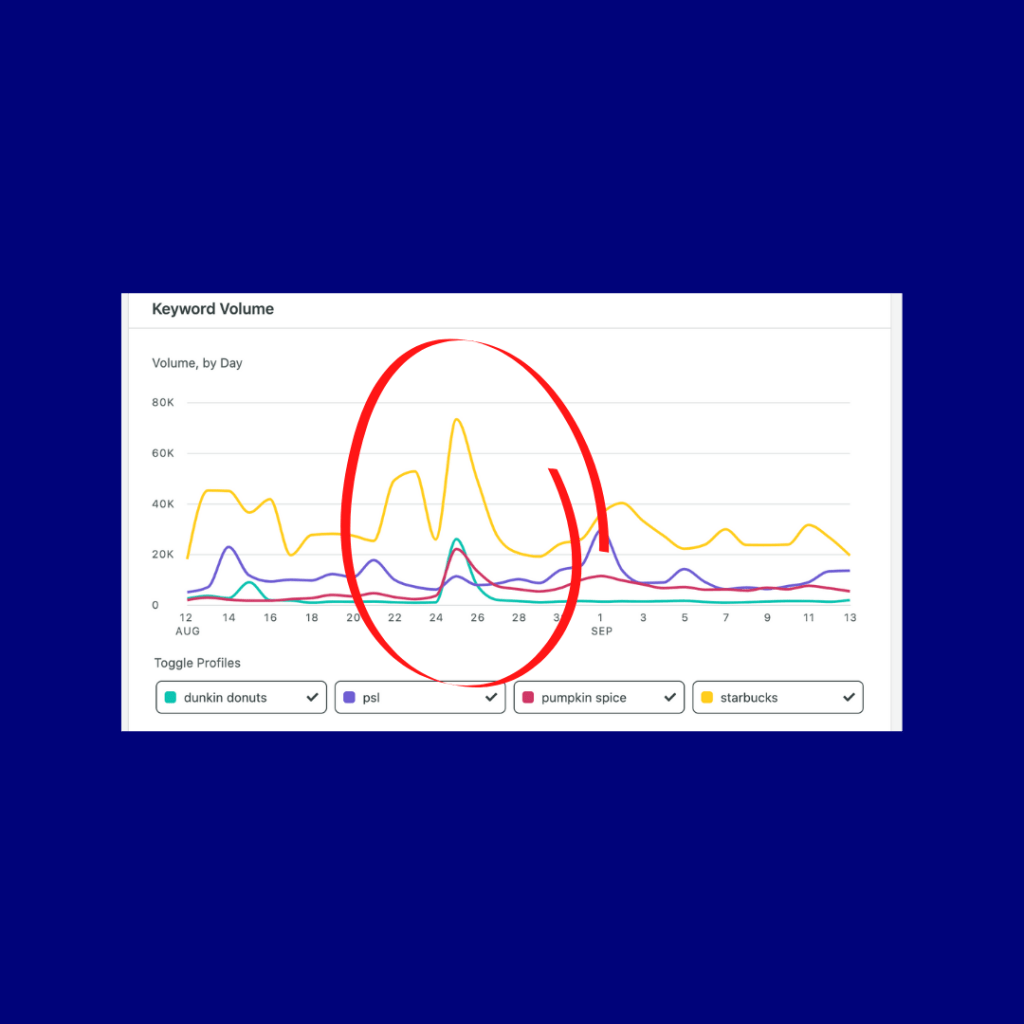
This chart indicated the four different keywords as discussed above. Each has had some use within Twitter traffic, with Starbucks having more chatter than any other. What I did in this graph was circle the obvious uptick’s within the graph. One way to determine this uptick is that we could assume something major had to have happened this day. Notice how all lines spike up on August 25th, 2020. Why is that? It turns out that the reason these words had so much usage on Twitter that specific day, is because there was indeed an event going on. Did you click on the links for Starbucks and Dunkin Donuts up above? If you did, you’ll know that both brands released their Pumpkin Spice flavored products that day! Being able to read into why there might be an increase or a dramatic decrease in the usage of keywords, is important! Remember, this will help you understand trends and how to predict what could be done next.
Another great business insight one could draw upon is the comparison of the keywords themselves. It seems as though Starbucks is talked about more than Dunkin Donuts. This is evident by how high the volume is for Starbucks compared to any of the others. One could also determine that Starbucks may have a stronger presence on social media, particularly Twitter, compared to their competitor, Dunkin Donuts.
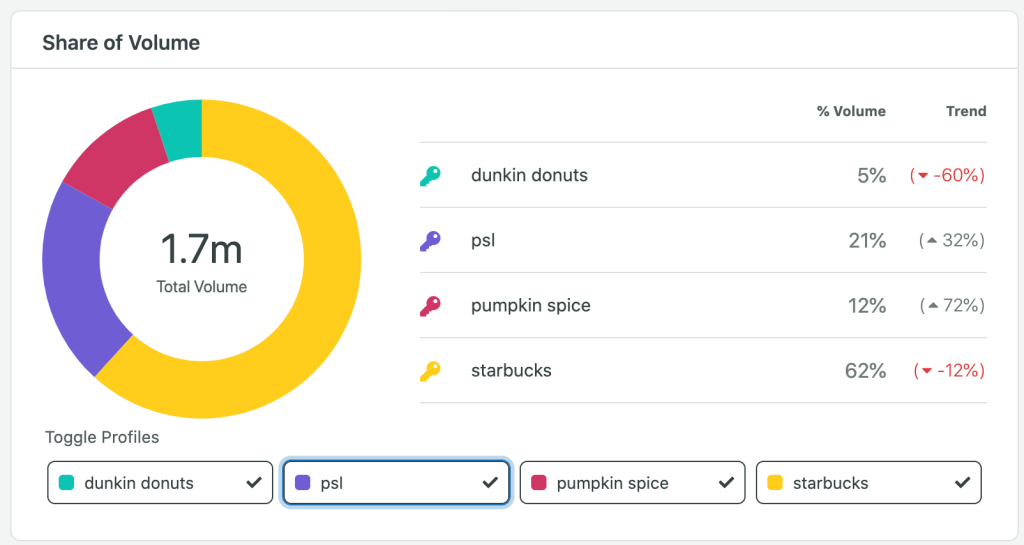
As you can see, the Twitter Keyword report will go a step further and breakdown how much volume each keyword holds along with how each is trending. Allowing the user to also determine more detailed analytical data as well. The keyword, PSL, also seems to be doing better than the keyword, Pumpkin Spice. With a volume of 21% and a 32% increase in trend. This information is just as crucial as it helps signify for brands like Starbucks and Dunkin as to what language works better for their current and new audience. One could determine that the abbreviated version of Pumpkin Spice (PS) could do better than the whole word itself. Keep in mind, PSL does stand for Pumpkin Spice Latte. However, saying the abbreviated version is clearly more trendy than the whole name itself. This may seem silly to some people, but these details can make a major difference when making meaningful business insights when planning a companies next campaign.
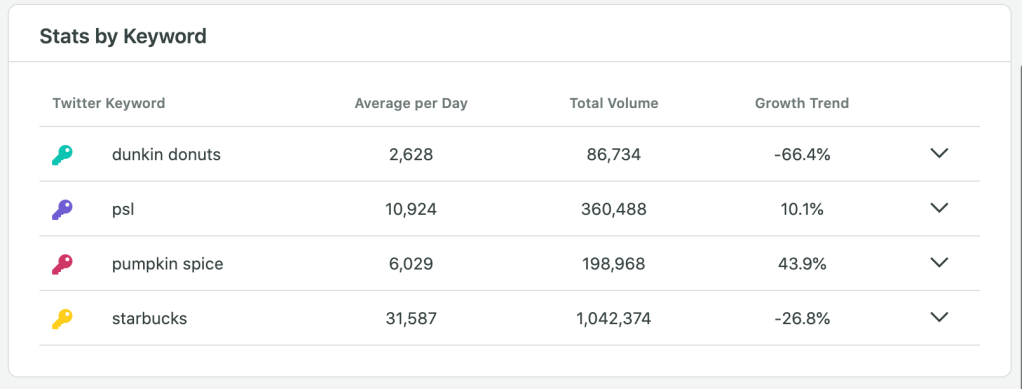
Our predictions could play true especially looking at the Stats by Keyword. Starbucks is mentioned on an average day at 31,587 while Dunkin Donuts is at 2,628. These details will help companies grow their efforts with current and new audiences and these are just some of the ways of how Twitter Keyword Report can make meaningful business predictions!
Thanks for reading!
-Austin
