The Basics of Social Media Data
A social media post can give an abundance of data to a user if it is being analyzed correctly. There are the basic variables of data which helps in understanding how to analyze any post. These basic variables are observations that can be made by the user or by the viewer (if the creators privacy settings allow); one could observe the following at first glance:
- The time of day a post was made
- The content of the post: Text, call to action, imagery/video, external link
- Engagement: How many people liked, commented or shared?
Now these are usually the first few things one may notice. Depending on the social network one is using, the platform may offer a more in-depth view of metrics to be analyzed by the creator of the post. I will be analyzing a personal post made on Instagram. While I am on other social media platforms, I enjoy Instagram because my page is set up as a business account which allows me to gain further insight in understanding how my followers interact with my posts. For more information on understanding the difference between a personal instagram and business Instagram account, click here.
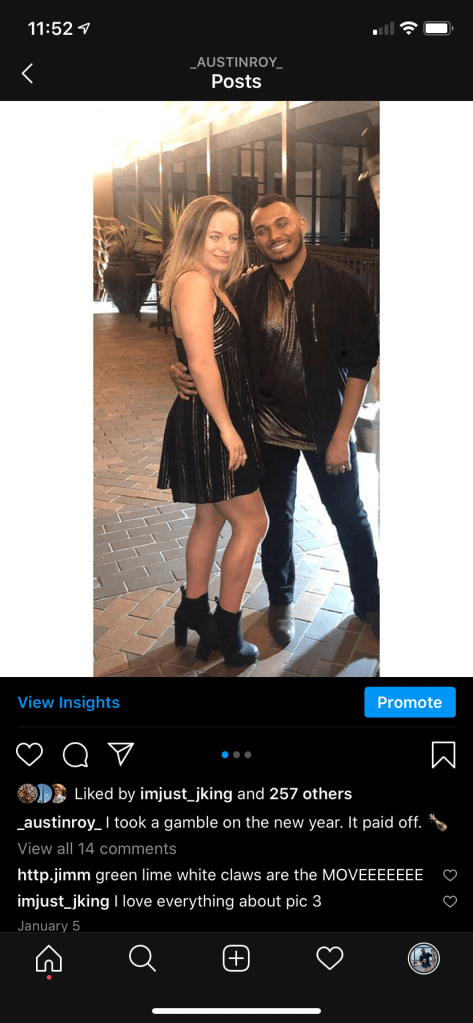
This image answers the basic variables described above and can be observed by anyone hovering over the image. From this view we can gather the following basic data:
- Date/Time/Location: Sunday. January 5th, 2020 (shown in image below) , Foxwoods Resort Casino
- Content: Image & Text (Quick Caption)
- Engagement: 257 likes, 14 comments, 34 profile visits, 1,240 reach
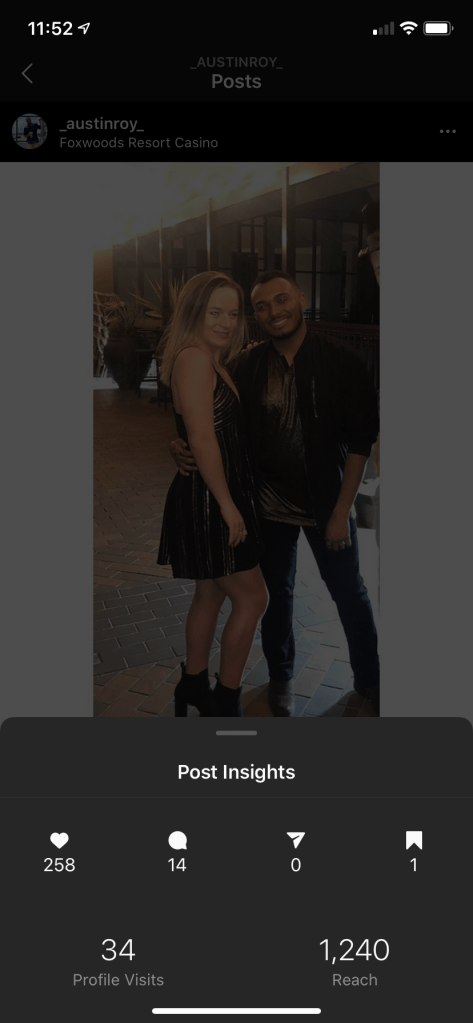
Now analyzing this basic data is great but we can’t make any real conclusions unless we compare to another post. Below you’ll find an image I had posted on Sunday, December 15th, 2019:
This image displays almost the same information as shown in the first image:
- Location/Time: No Location tagged. December 15, 2019
- Content: Image and Text (caption)
- Engagement: 141 likes, 2 comments, 3 profile visits, 975 reach
Now let’s compare the two and make a basic conclusion. Both of these images were posted on a Sunday. They each have a photo and a few words in the caption section. The only difference here is that this image does not have a location set. If we wanted to make a quick conclusion at analyzing this basic data, we could say that this image could have done better if there was a location tagged along with it. This could be a general conclusion for anyone who is not the creator of this post. Thankfully, Instagram offers their Insights tool to those who have a business account. Let’s go a step further and continue analyzing the Image from Foxwoods Resort Casino.
In-Depth with Instagram Analytics
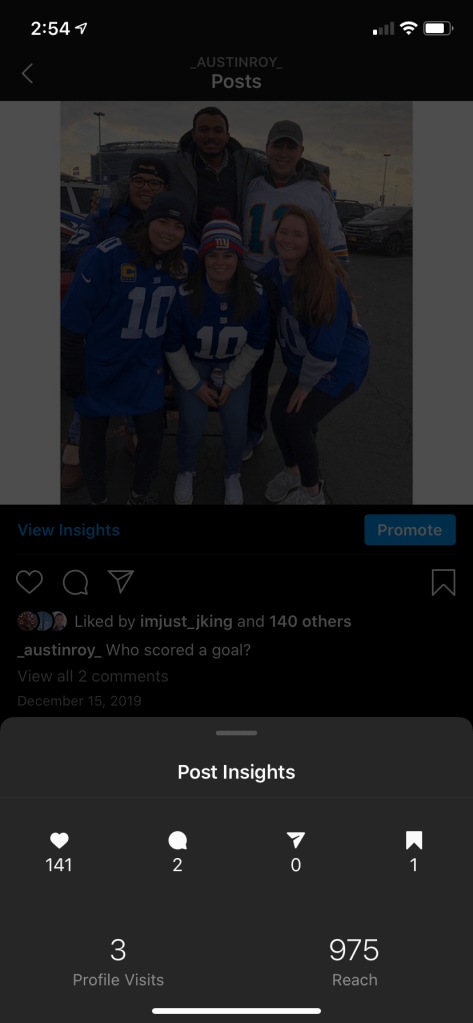
I can click the highlighted View Insights option on the photo. This will give me Descriptive Analytical Data which is a detailed view of how many impressions were made, people reached, profile visits and more.
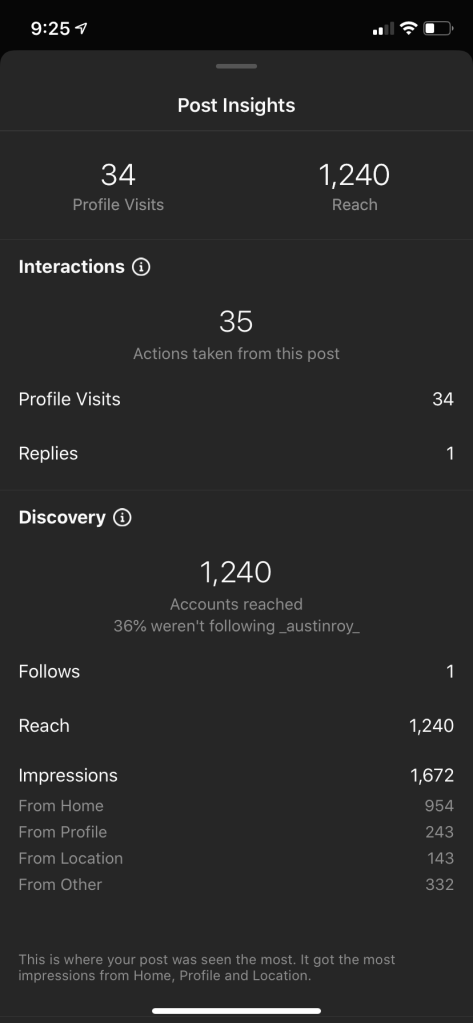
As you can see, this option displays greater detail for the creator. I am able to expand on the basic data and zero in on different categories that could help forecast my next post to be made. Now it is important to determine what analytics are most important to you. A lot of times, certain tools will give you more than what you may need. For purposes of this blog, let’s say I am most concerned about brand awareness. Since I am most concerned about brand awareness, I am going to want to keep an eye on the number of impressions made from my post. What I enjoy about the Instagram Post Insight option is that it allows me to evaluate my followers in great detail. Since I care most about my impressions I am able to see a clear breakdown of where impressions occurred:
- Total Impressions: 1,672
- From Home: 954
- From Profile: 243
- From Location: 143
- From other: 332
knowing where my impressions came from, I can now figure out what I need to do to improve these numbers for my next post. I see that my number for location is lower than the rest on this list. Now if I was some sort of brand and I truly cared about increasing my impressions; I may want to do research on what locations/destinations have the most traffic when it comes to clicks. What do I mean by that?
Geographical location can play a major role in reaching an audience. While it is nice to simply state where you are to keep your followers updated; it gives you (the creator or brand) the potential to expand your exposure, increase your engagement efforts, and increase traffic (customers) to your page. For more on why location tagging is important, please click here.
A Different Perspective of Instagram Analytics
The example above gives an in-depth view of understanding an Instagram post’s analytics and how to point out certain characteristics. It displays the basic data that the creator and the viewers could gather while also diving into post insights and how specifically, a creator could use that data to help further his/her agenda at first glance.
I stated above that I wanted my impressions to increase, primarily from my locations. We determined that I could increase my impressions from location by doing more research on what tagged locations have more click traffic. Keep in mind, this was a conclusion made at a first glance of the impressions listed above. We will still be analyzing the same post but this time we will be looking from a different angle. Let’s say I still care about brand awareness but now I want to optimize my exposure efforts. The Instagram Insight Tool breaks down a number of different data sets that could help anyone depending on what it is they are looking for. You can access the Insight option through your profile:
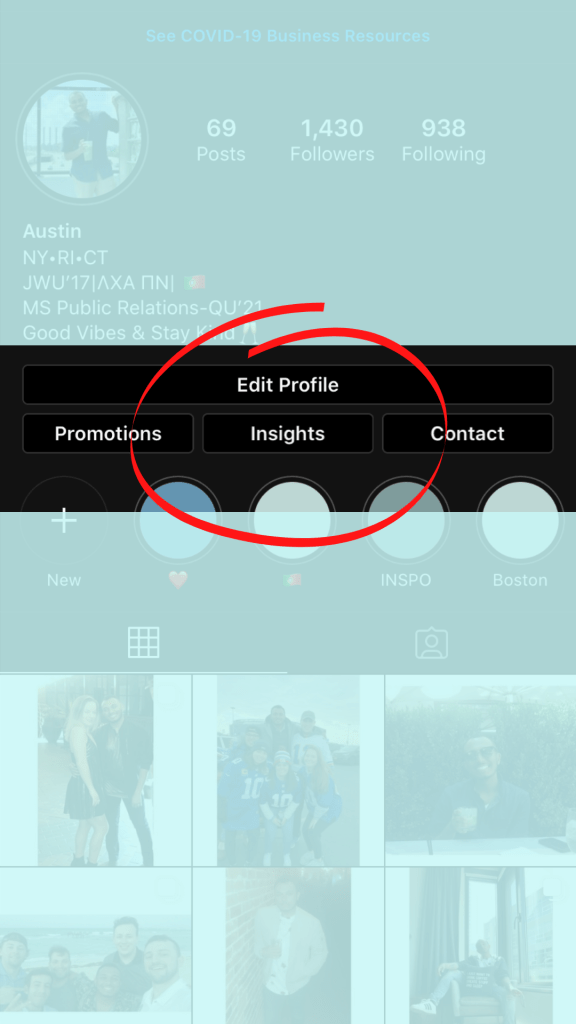
Remember, this option is only seen and can be accessed by you as long as your profile is set up as a business account. Once clicking on this option you’ll be met with a screen that shows you a quick snap shot of your most recent activity as seen below:
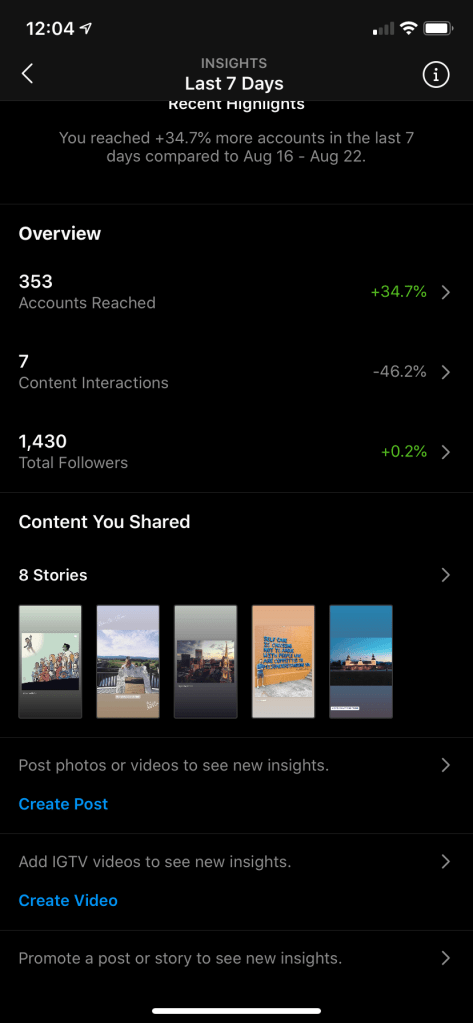
This will give you a seven day overview of your most recent activity. If you click on Total Followers you will see the following:
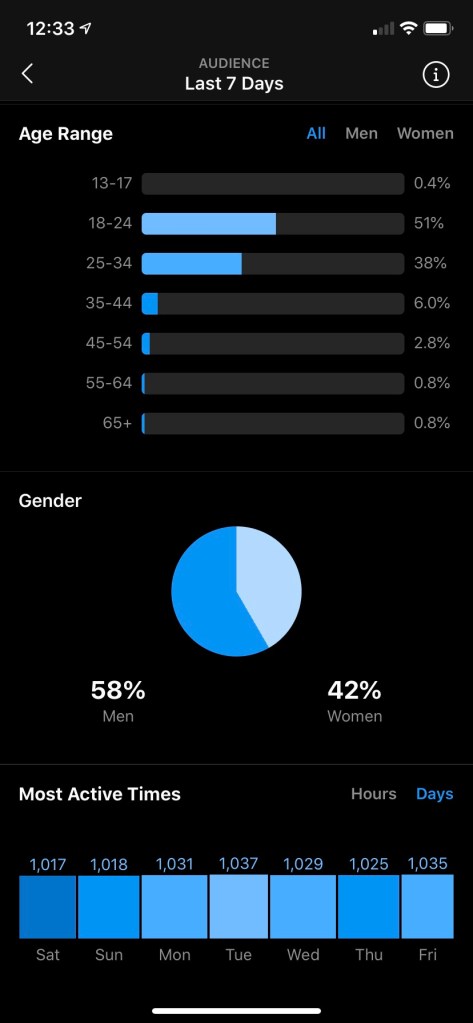
As shown above, it will give you a view of most active times broken down by days and three hour intervals along with gender and age groups of your followers. This overview will also break down where most of your followers are located by city, state and country, and growth of audience (not shown). Since this second scenario has to do with time, we will be paying attention to the Most Active Times section. Keep in mind, we are still analyzing the post from January 5th, 2020. What is nice about this tool is that it can also give a specific number of followers as to when they are most active:
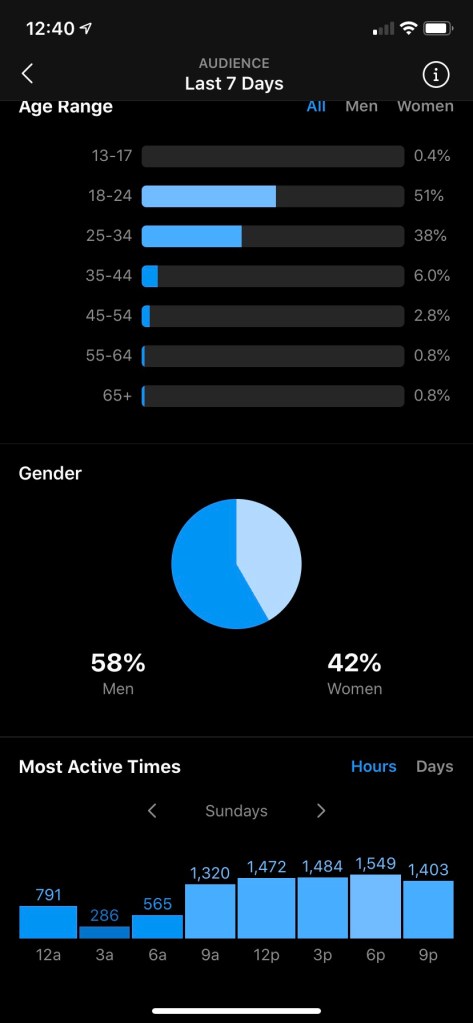
You can see above that there is an option to change the day displayed to help see what hours are the busiest for followers. I switched the day to Sunday as January 5th, 2020 fell on a Sunday. If I wanted to increase my presence on Instagram, at first glance- it might have been wise to have posted this photo between 6pm-9pm as that is when most of my followers seem to be active on Sundays. Now to further the point, if I was a brand and I wanted to maximize my full potential of increasing brand awareness or engagement, I may have wanted to pay closer attention to what day’s are the busiest for my followers. If we reference the image above that displays Most Active Days, we can see that my followers are most active on Tuesdays.

This image shows Most Active Times on a Tuesday. Judging from this data, the busiest times would have been between 3pm-9pm with the highest traffic around 6pm. For optimal exposure, It may be in my best interest to post something on Tuesdays between 4:30pm-7:30pm. But how did I come to that conclusion?
I was able to figure this out because Instagram Insights will break down the traffic of followers in three hour intervals which can help any user or brand strategically plan a post. Looking at that image above, I was able to see when most of the my followers are usually utilizing their Instagram, with 6pm being the most active. I was able to average the numbers of followers shown at 3pm, 6pm and 9pm, to find the most potential of optimizing brand awareness and engagement which led me to believe that posting something between 4:30pm-7:30pm (3 hour interval) would be most beneficial.
Now there are many other ways to analyze a social media post. Instagram specifically offers many great insights depending on what it is one may be interested in. I do find the Instagram Insights tool to be heavily focused around Descriptive Analytics. It provides a user statistics of profile views, impressions and audience demographics. You are able to compare each profile post or story to one another if desired. Being most concerned about brand awareness, we were able to figure out when the best time is to post and break down which impression segment needs more of a boost when posting. This is a great tool to use to help see what is driving new or potential followers/customers to your profile and how you are doing with your current followers.
I recommend anyone who is interested in entering into the communication field to highly consider having a business profile. It may seem silly at first if you don’t consider yourself a brand or have a business to offer. However, acquiring small analytical tools such as this and analyzing behavior of your followers can help strengthen your skill set when tasked to handle social media presence for a major brand or project. Creating social media content can be exciting but you’re going to want to be able to analyze the data from past and present to forecast the success of your future posts.
Thanks for reading!
-Austin

One thought on “Analyzing an Instagram Post”